Transaction Monitoring User Guide
Dedaub's Security Suite Monitoring is a fully customizable operational security blockchain monitoring solution, to be utilized on projects that have already been deployed on-chain. Monitoring does not detecting issues on the application's source code. Instead, it can be used to detect or react to on-chain activity in a fully customizable way. Transaction monitoring uses a modified PostgreSQL database at its core coupled with concepts from incremental computation. The PostgreSQL database benefits from an advanced query planner and allows us to maintain a global, consistent view of blockchain data. The database has been augmented with the following concepts: time-series tables, delta-tables, incrementally materialized views, and just-in-time blockchain data decoding. This approach allows for highly-complex and highly-dependable monitoring agents to be written in a few lines of SQL.
Examples of monitoring agents that can be easily written in Dedaub Security Suite:
- Large transfer of funds to or from yield farming vault
- Timelocked transaction executed before timelock expiration
- Flashloan in a transaction involving my protocol
- OFAC sanctioned user utilized my protocol
- Liquidation positions not liquidated in time
- Chainlink Oracle not updating regularly enough
- Keeper parameters outside of bounds / abnormal
- Admin function called and succeeded
- Protocol vault dipped below a certain balance
- 20% of vault withdrawn over 5 minutes
- Abnormal sequencer transaction ordering
- ...
The security concerns are correlated with your application's domain, and many of the agents that can possibly be written do not apply for your application.
Let's start our tutorial by introducing the GUI Users can write arbitrary SQL queries on the set of tables exposed to them, configure the queries to run periodically on a recent slice of data (e.g., “last 5 minutes”) and set up custom email alerts that will issue notifications when the query produces results.
The query editor
The query editor is the main stage of the transaction monitoring facility. Here a user can write, run, and save queries.
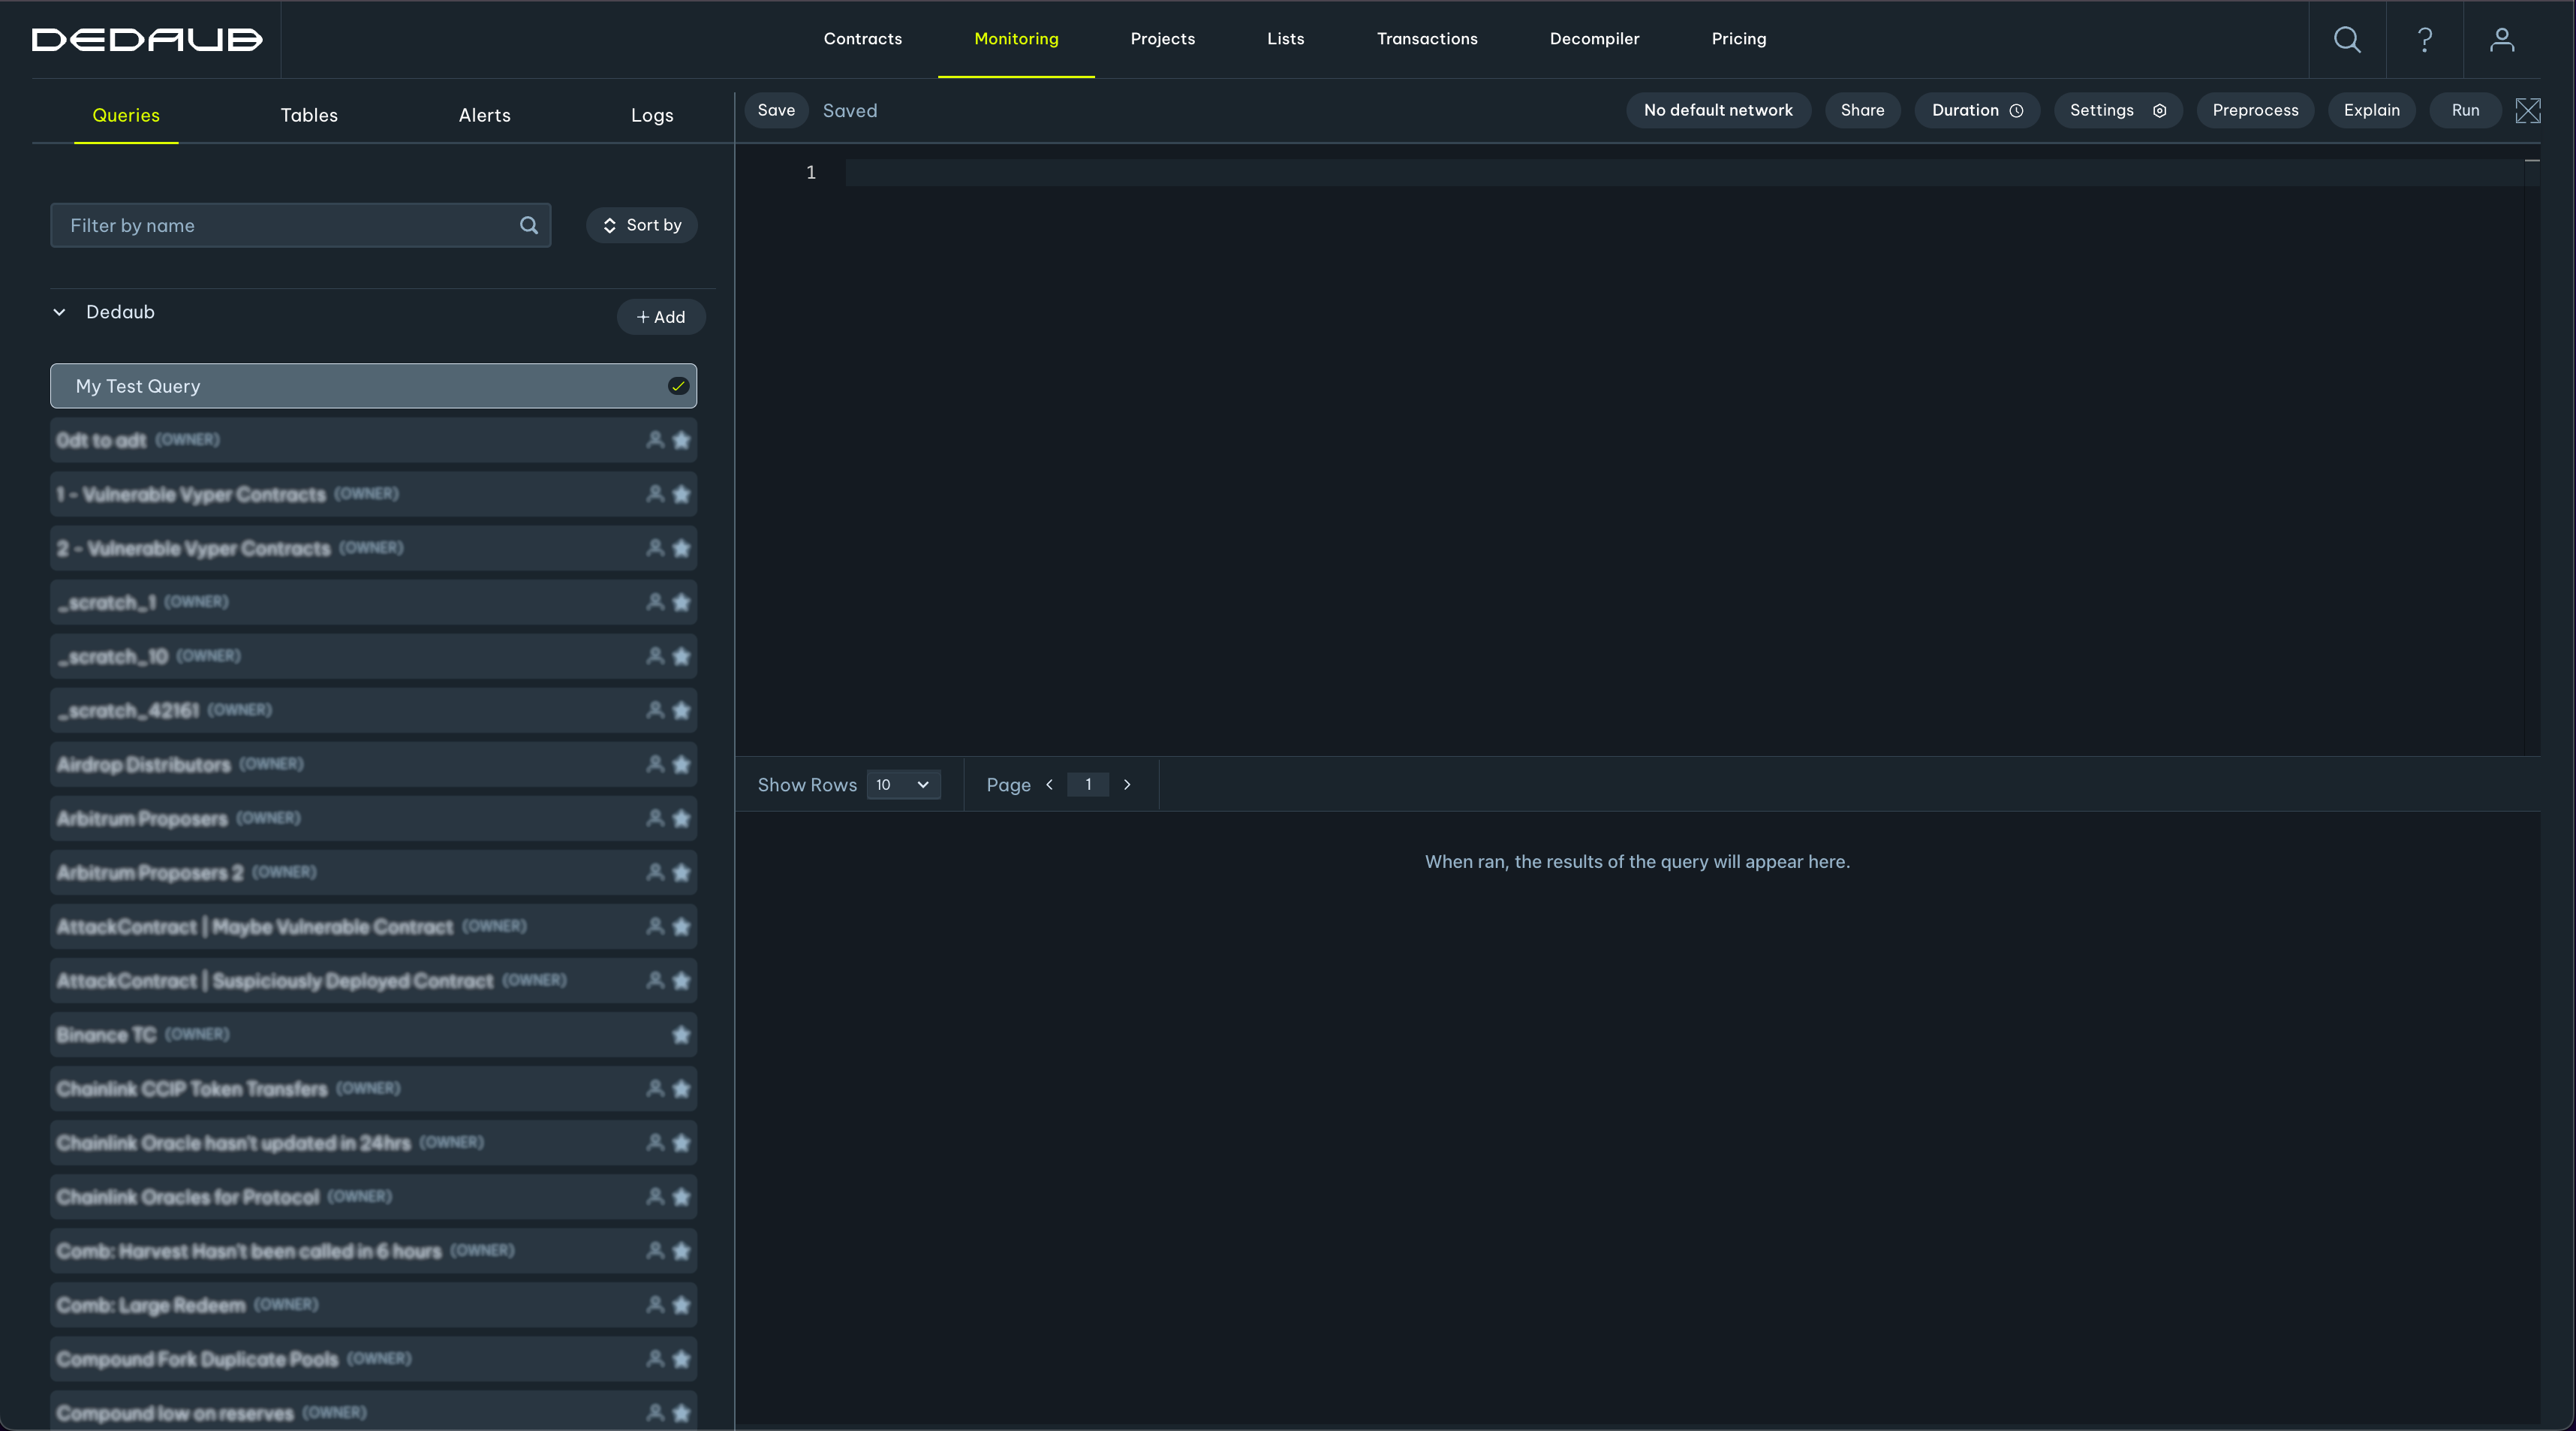
In the screenshot above we have created a new query and named it "My test query" ( the query name must be unique) by clicking the "Add" button next to our orgnization name.
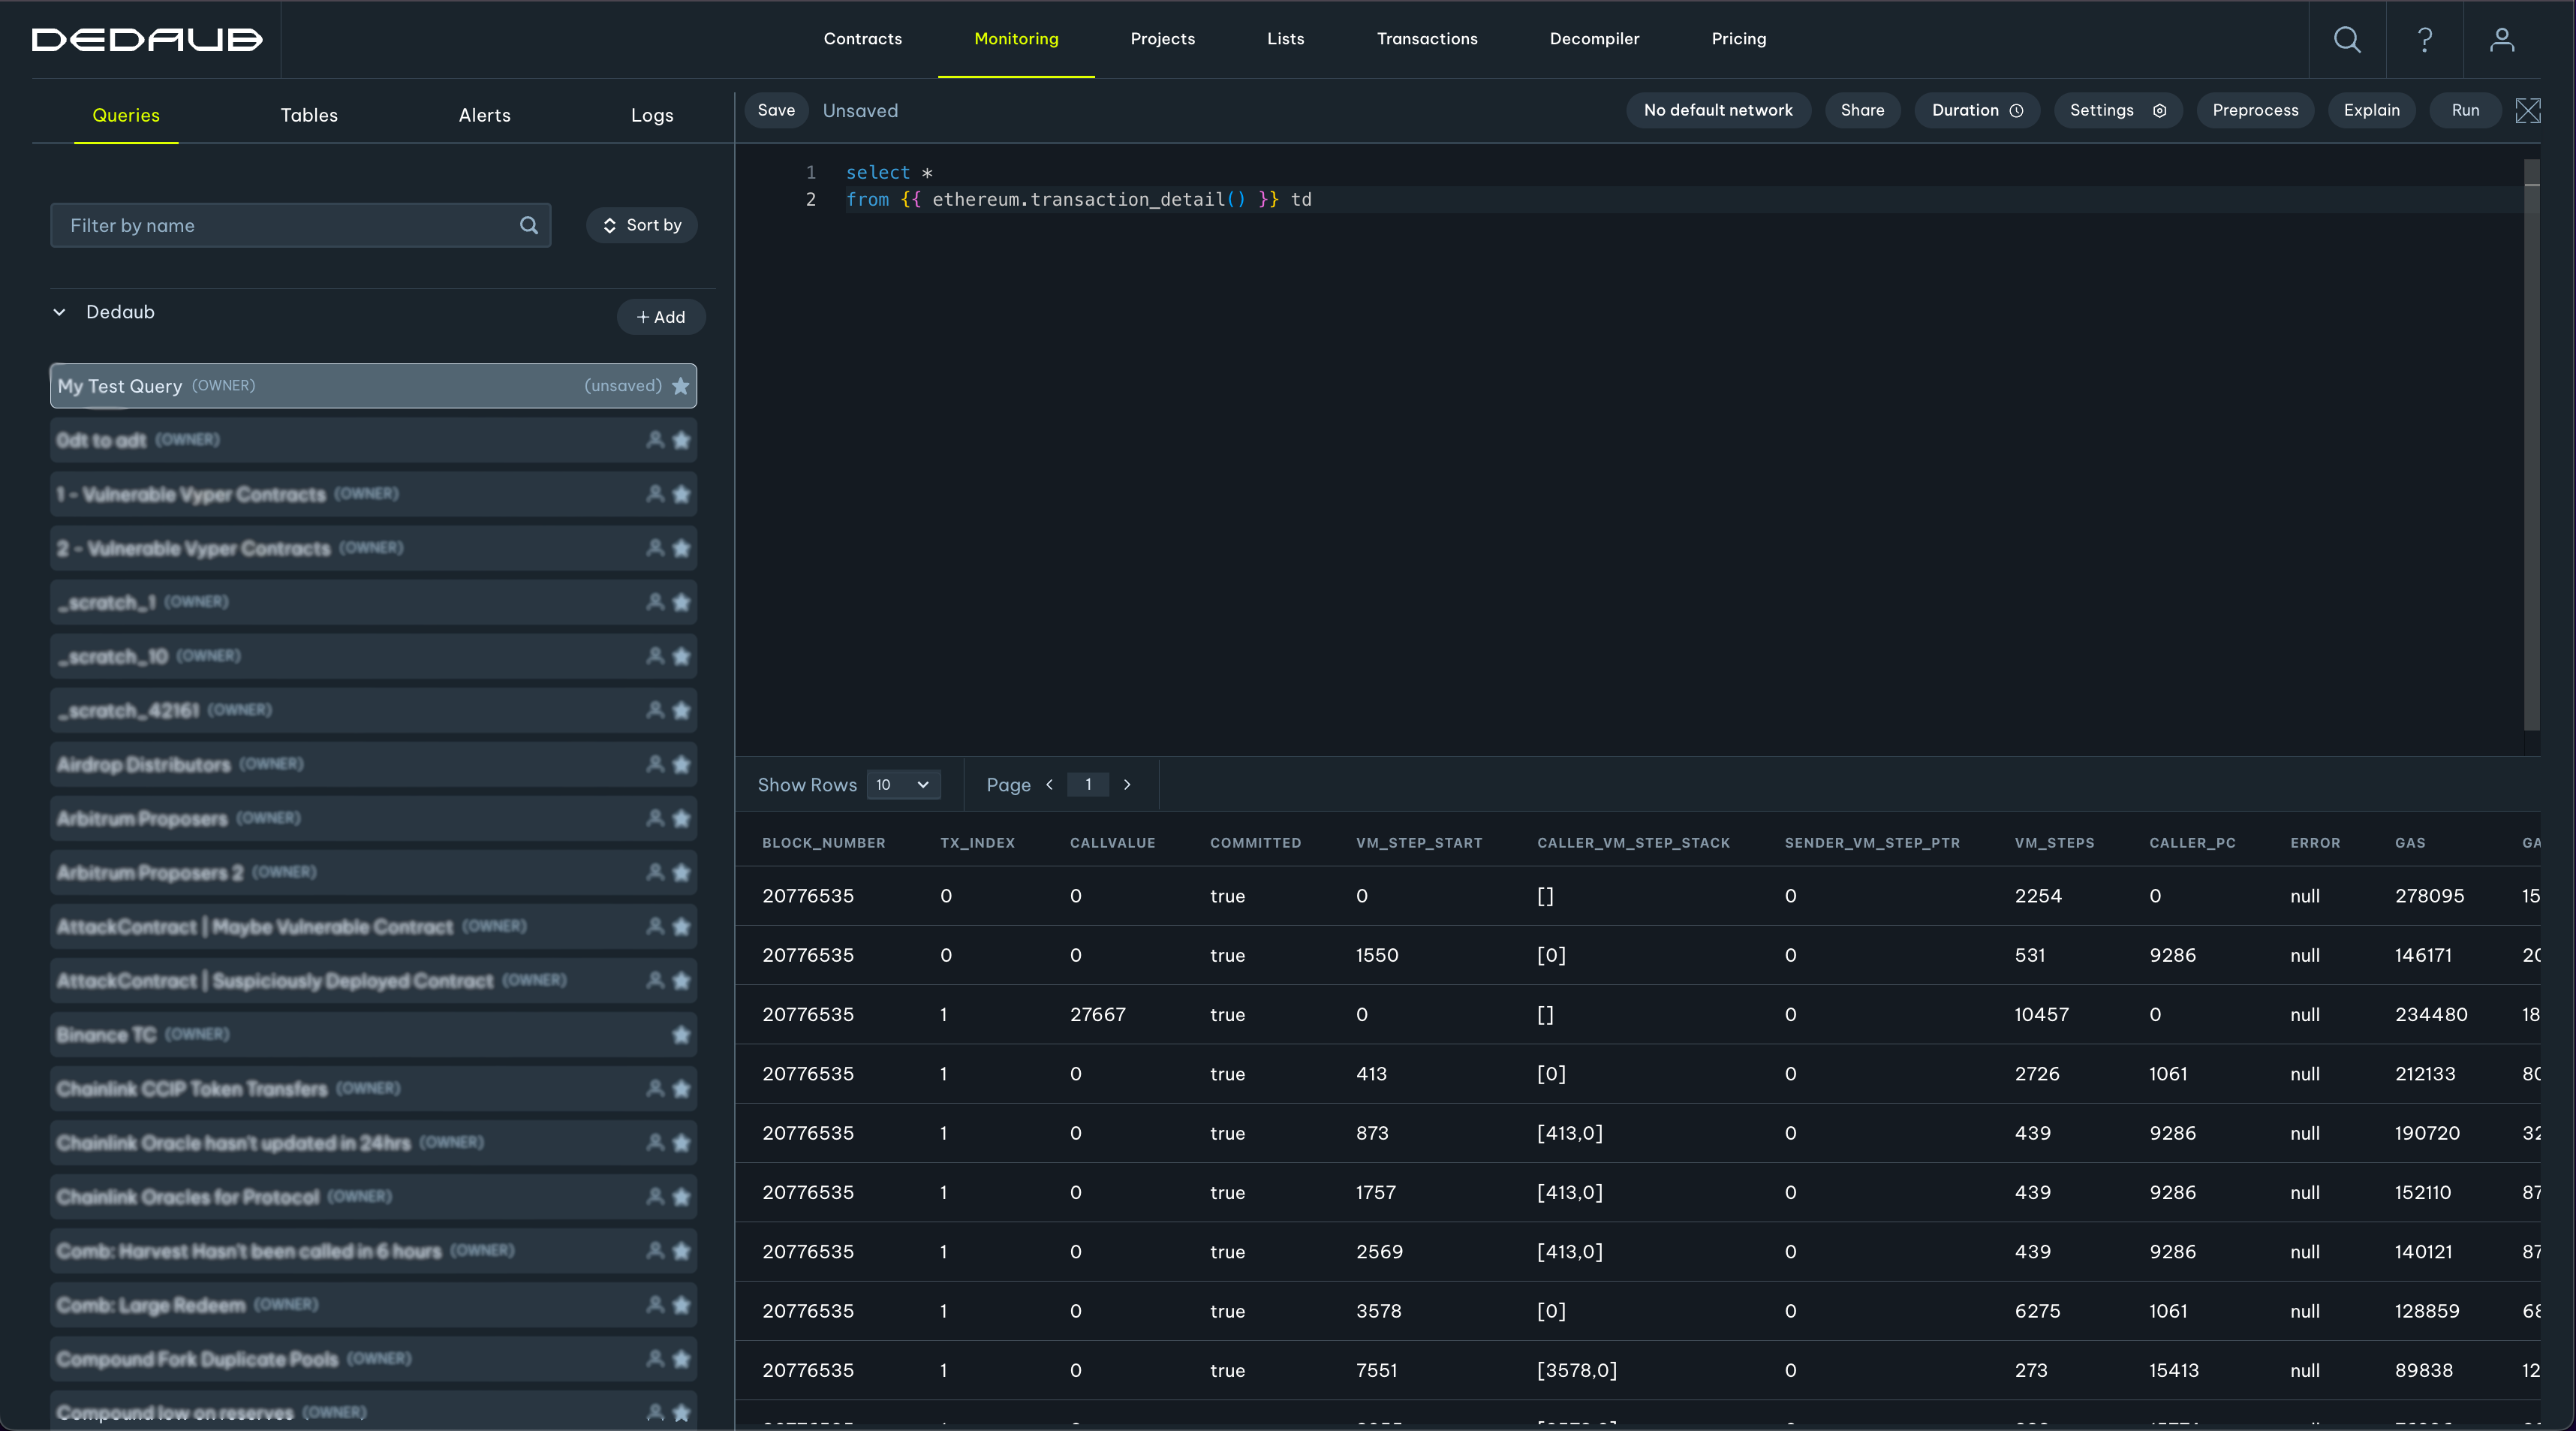
After that we entered and ran the following query:
select *
from {{ ethereum.transaction_detail() }} td
the results of which appear in the lower panel.
The astute reader may have noticed that the syntax of the query isn’t pure SQL. This is because we are using a macro language for our queries and have defined numerous macros that make certain operations much easier to write than handwritten SQL, such as table gadget or eth_call expressions, which will be further explained in the next section. To demonstrate, one can press on the preprocess button to view the “expanded” query in its pure-SQL form. In this case, the expanded query looks like:
select * from ( select td.* from ethereum.transaction_detail td where committed and block_number > ethereum.get_historical_block_number('24h'::interval) ) td
For more details about available macros and how to use them, check out the gadgets section.
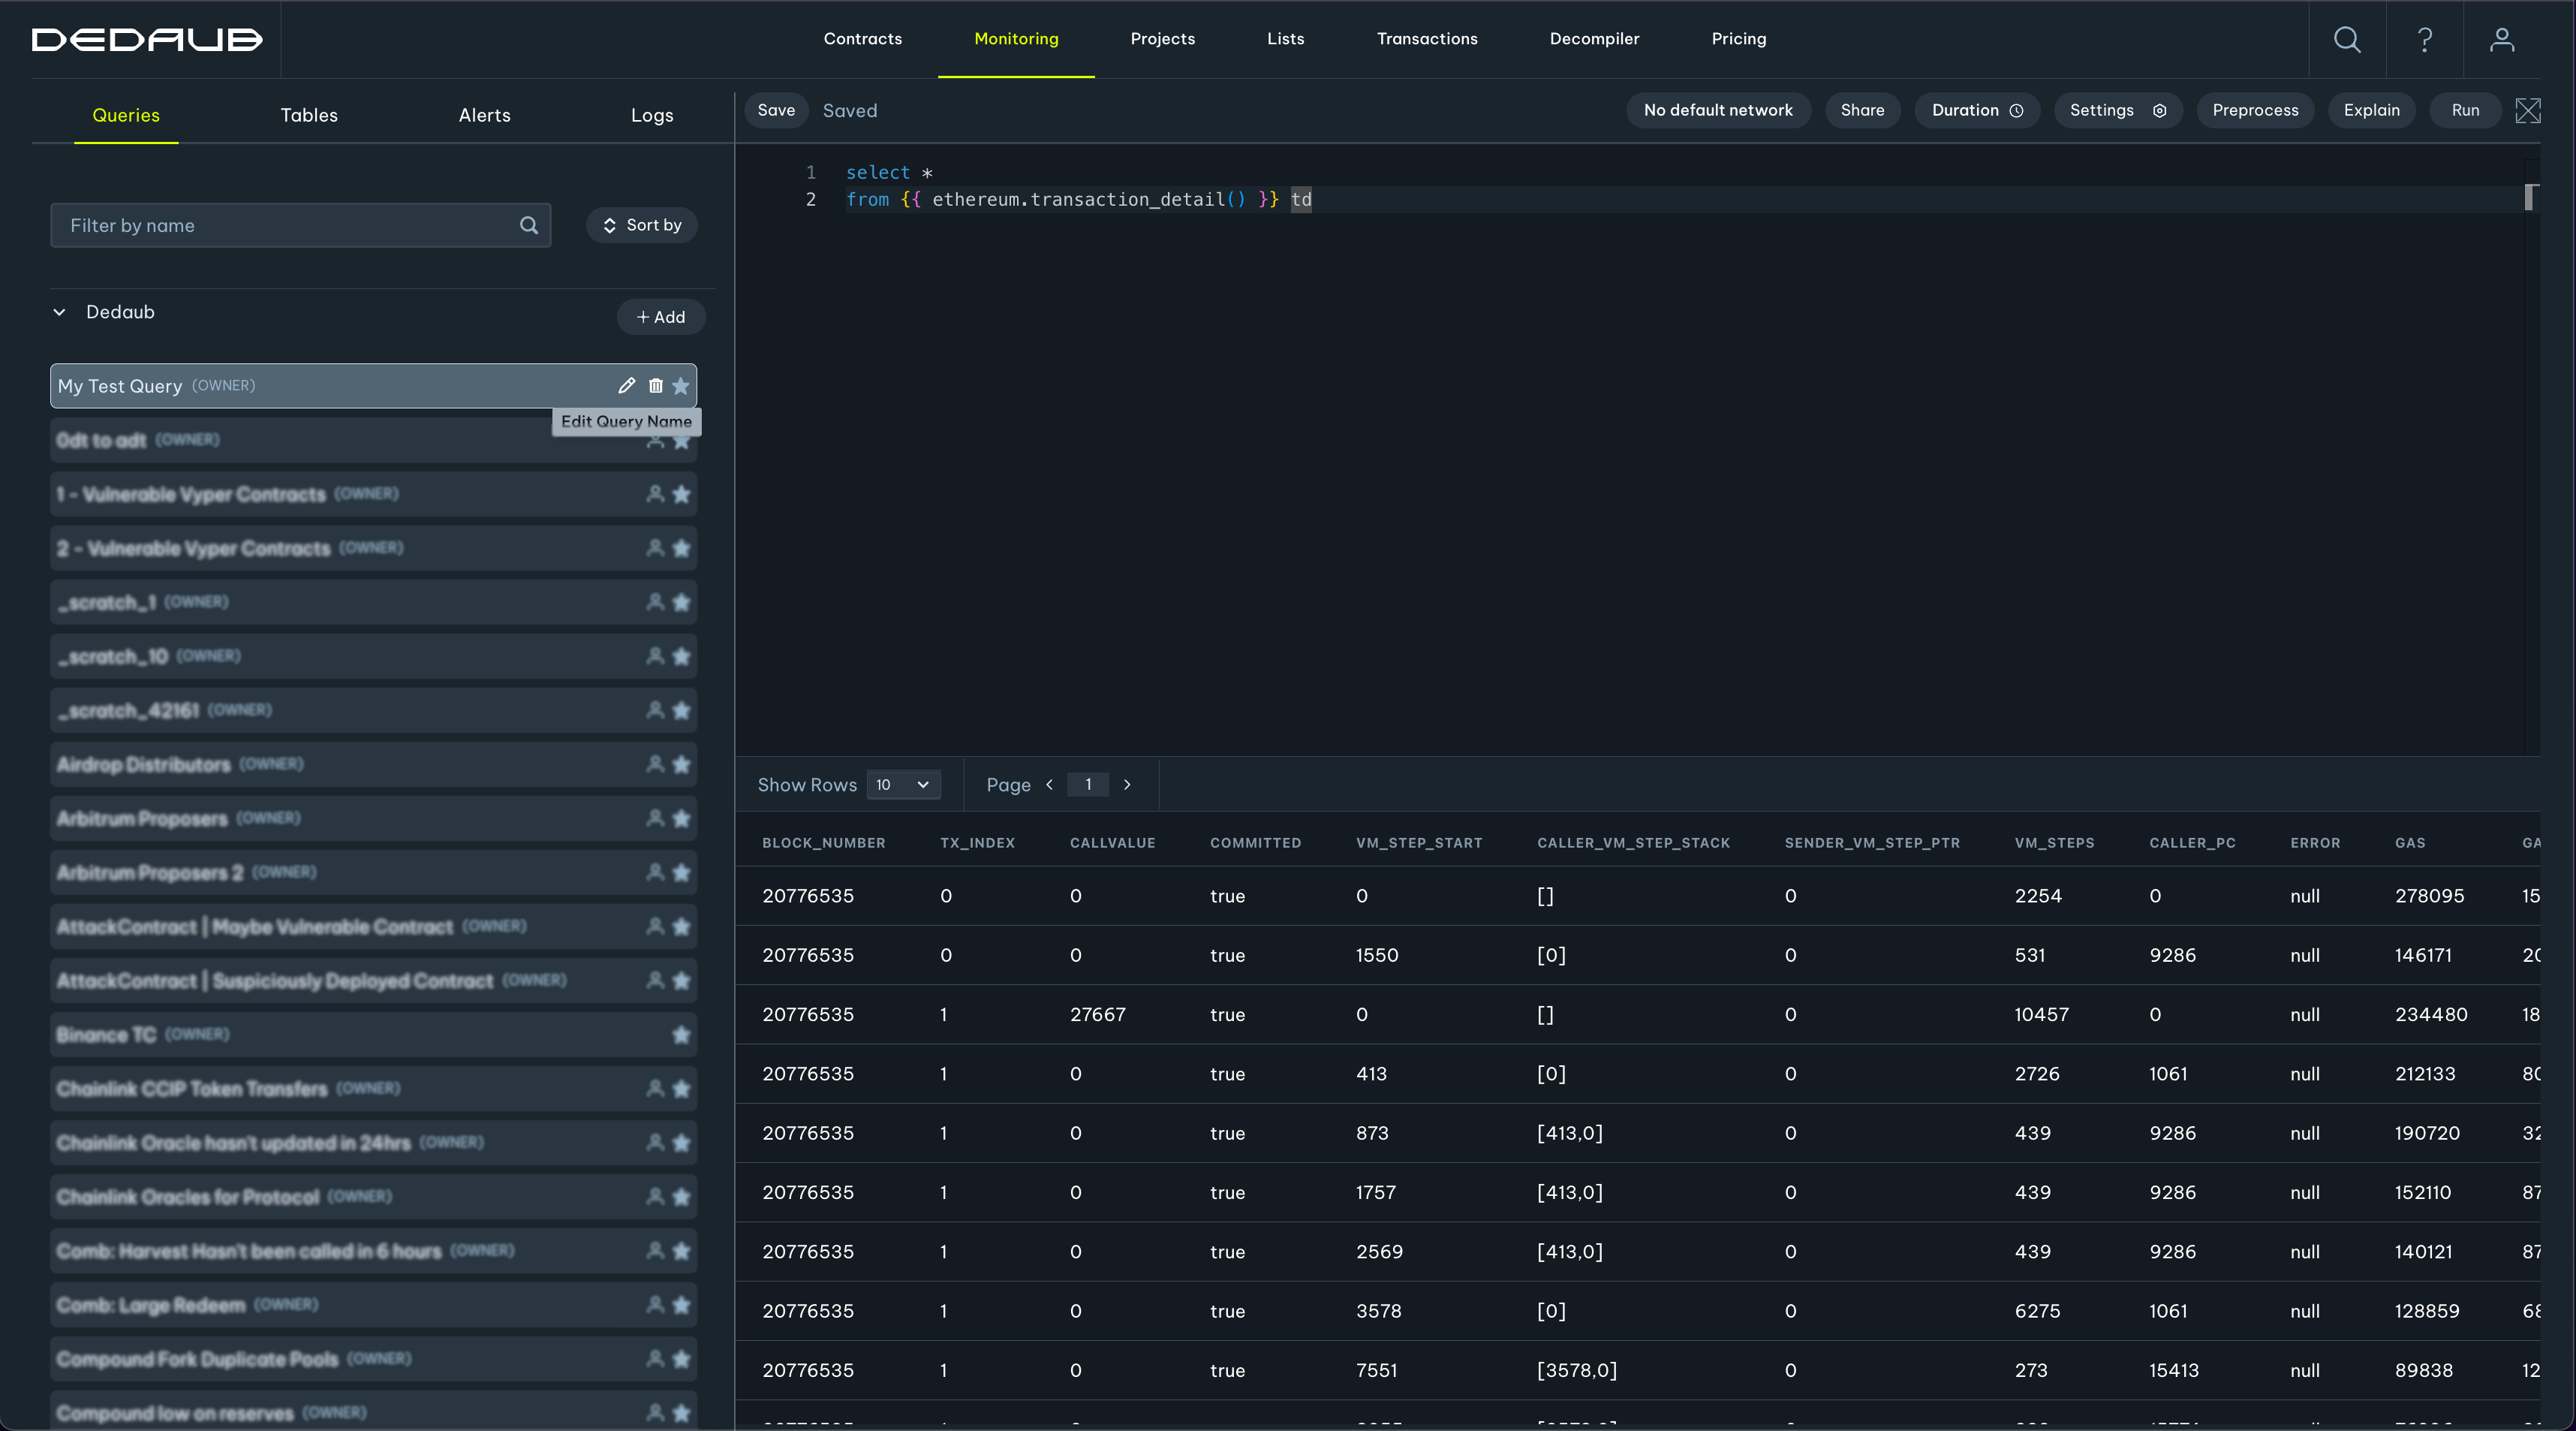
Changing the name of the query is simple and can be done at any point by hovering over our query and clicking on the pencil icon:
Default Network
For queries intended to run on a single network, a default network can be set through the UI. This eliminates the need to prefix every table, function, and gadget with the network name.
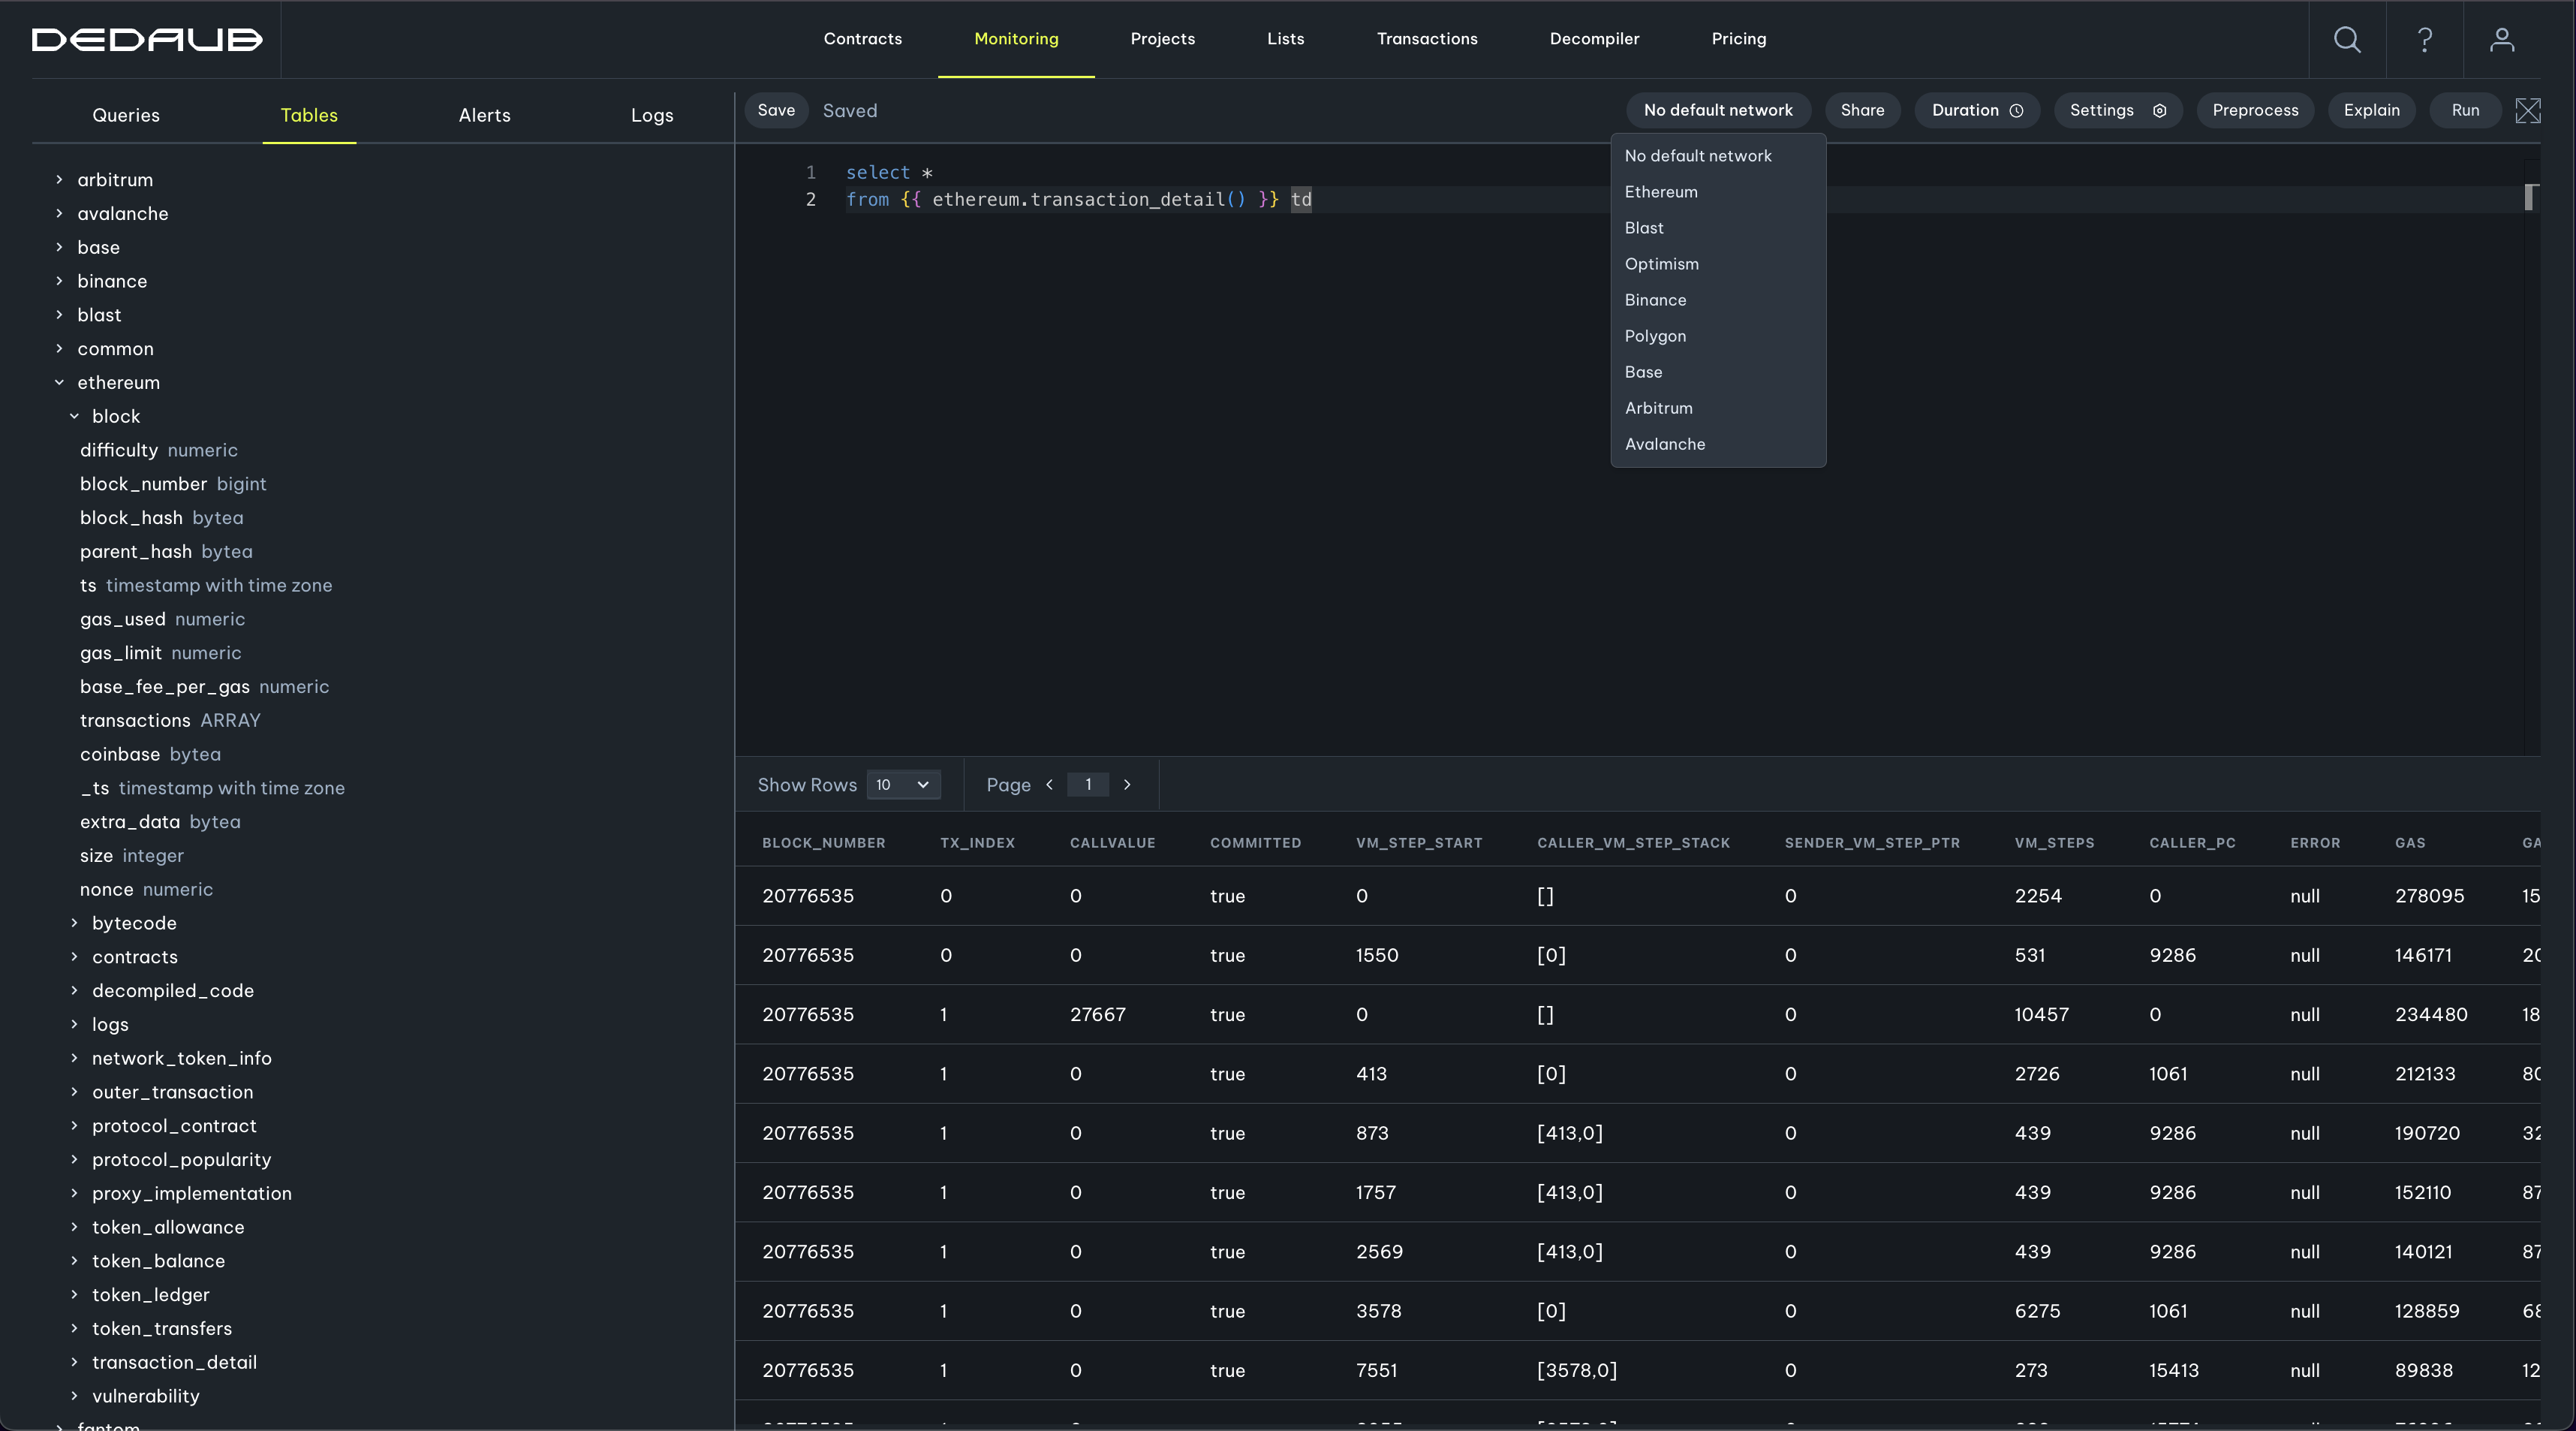
Choosing Ethereum as the default network means we can rewrite the above query as:
select *
from {{ transaction_detail() }} td
Left Pane
In the pane on the left, a user can see all the queries that are available to them. The user's Organization section contains the organization queries the user has access to. The user may be in multiple organizations. In this case there is a distinct section for each. The Others section lists queries created by other organizations which have been made public for everyone to view and use directly in their own queries. The Examples section contains useful examples of queries that demonstrate different features of the system in common blockchain monitoring tasks.
Still on the leftmost pane, clicking on the “Tables” tab replaces the query list with a directory of our database tables, available to queries:
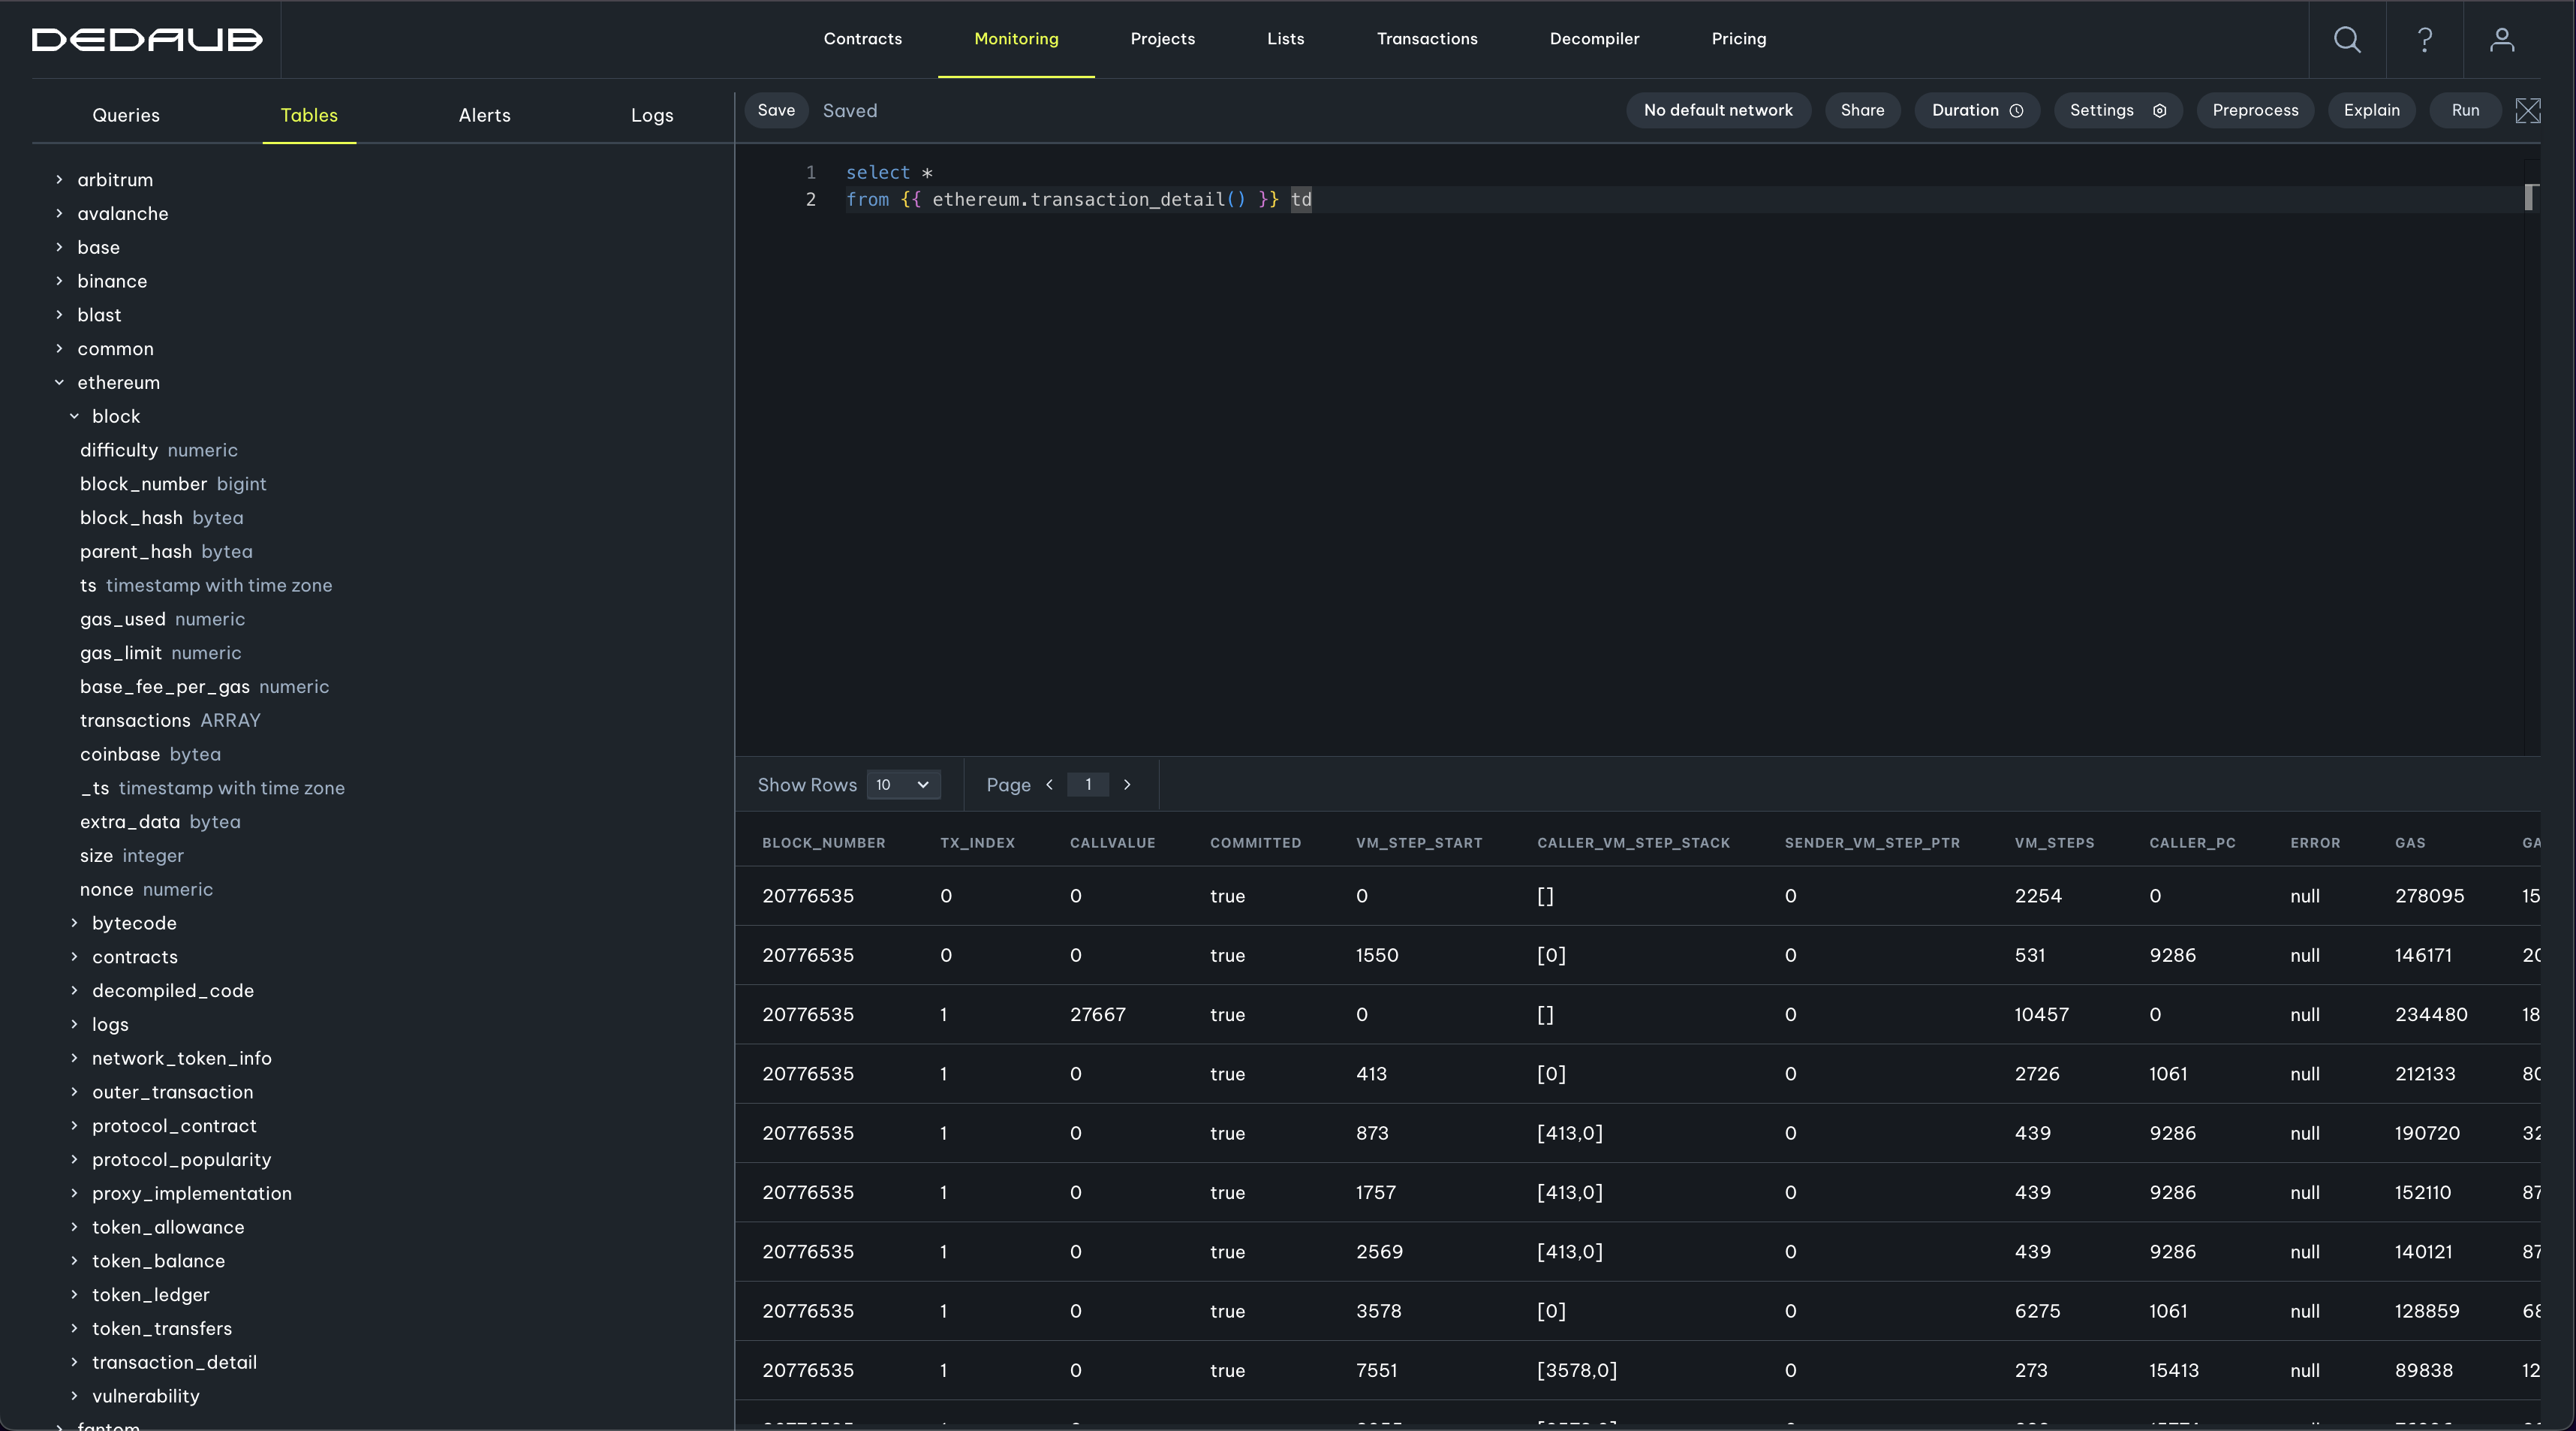
The directory is organized hierarchically, in the following order: schema > table > columns. For example, in the screenshot above we can see that the table block which is under the ethereum schema has a series of columns, such as block_number with type integer
The "Alerts" tab contains a list of all the alerts that the user has received.
Finally, the logs tab contains historical information about past runs from scheduled executions. We’ll talk more about Alerts and Logs in the query configuration section.
Execution Model
Now that we got a glimpse of a query, the next step is to understand the execution model of the monitoring agents. The execution model of these (queries that are switched and executing continuously as alerts) is that of a monotonic query executing on top of new blockchain data, applied per frequency period in temporal order. The main tables describing new time-series blockchain data are:
block- This table contains metadata about newly mined blocksouter_transaction- This table contains metadata about an on-chain transaction, such as the initiator (from_a), the amount of gas used, block number (block_number) and index within this block (tx_index)transaction_detail- This table contains all inputs and outputs to every EVM stack frame, including thecalldata, thereturndata, and the actual VM step in the current transaction at the beginning of the current EVM stack frame (vm_step_start).logs- This table contains all the logs emitted recently, and includes all associated data, including references to the current EVM stack frame.token_ledger- This table contains double entries for all tokens or native cryptocurrency that is entering and exiting a specific blockchain address. It also contains references to the current EVM stack frame, and VM step for when the transfer took place.
The tables, above, which contain newly arriving blockchain data are subsequently also overloaded as macros that implement Table Gadgets. These gadgets allow you to instantly extract high level function input and output, restrict the blockchain data to specific addresses or signatures, or add temporal conditions to the newly arriving time-series blockchain data such as adding a delay or overlap to previously arriving data, while remaining consistent with the actual blockchain state.
Table Gadgets
Table gadgets are macros that allow for ergonomic synthesis of queries that would otherwise be too cumbersome, clunky or error prone to write by hand. Furthermore, the use of gadgets is essential if one wants to turn their query into a continuously-running monitoring agent, or materialized view.
Time-Series Table Gadgets
The time-series tables we saw in the previous section are also overloaded as table gadgets. The difference between the raw blockchain data tables and their table gadget counterpart (which we will be referring to as chain table gadget) is that:
Chain table gadgets can take a duration argument that limits the time slice on which these operate. By default, the time slice will be equal to the frequency of the agent. However, in the case the query is being run from the editor, this can be set using the duration widget.
The first (optional) argument of the chain table gadgets is both a filtering and decoding expression. For instance, in the query below:
select owner, ethereum.tx_hash(block_number, tx_index)
from {{ethereum.logs('0xd9Db270c1B5E3Bd161E8c8503c55cEABeE709552.AddedOwner(address owner)')}} _
Only the logs pertaining to address 0xd9Db270c1B5E3Bd161E8c8503c55cEABeE709552 will be returned, and from these only the ones matching the signature of AddedOwner(address). In addition, the event data for these kinds of events will be automatically decoded according to this signature, and the variable owner in this case can be projected or selected on in the rest of the query. There are a couple of additional considerations:
- Note that typing in the editor
logs('0xd9Db270c1B5E3Bd161E8c8503c55cEABeE709552.launches autocomplete suggestions for that address, which facilitates the writing of the table gadgets. - Both the address
0xd9Db270c1B5E3Bd161E8c8503c55cEABeE709552and the signatureAddedOwner(address)can be omitted. In the case the address is omitted, all events emitted on chain matching that signature are returned. In the case the signature is omitted, all the events pertaining to that address are returned but only the raw event data is available since decoding the event requires the signature. - transaction_detail
andlogscan be filtered by both address and signature. Whiletoken_ledgerandouter_transaction` can only be filtered by address.
Referential Gadgets, i.e., the ref macro
The refmacro is used to reference other queries that the user has access to (either queries they’ve authored themselves or queries that others have made public or shared with your team). This is useful for referencing materialized views, which enable more complex monitoring agents. TODO get docs from DBT
ref(table: str, owner: Optional[str] = None, materialized: bool = False)

Arguments:
	table (str, required):
		The name of the query being referenced. It should contain the path to the query, e.g. /<folder>/<table>

		If the query resolution fails, an error is raised.

	owner (str, optional):
		The username of the author. If left as None, then the resolution algorithm will
		return any matching query from the system, prioritizing user-defined queries over
	  3rd party ones.

		If the query resolution fails, an error is raised.

	materialized (bool, optional):
		A boolean flag indicating whether to use the materialized version of a table or not,
    which is enabled by default if the table is materialized.

		If the referenced query is not configured as materialized, or hasn't been scheduled
		for materialization yet, an error is raised.

Returns:
	A select subquery with the shape of the referenced query.
Examples
-- Example 1: reference query "suspicious addresses" but exclude addresses that are in a 3rd party whitelist
select susp.address
from {{ ref("suspicious addresses") }} as susp
where
susp.addreess not in (select whitelist.address from {{ ref("trusted addresses", owner="some_other_monitor_user") }})
contracts table gadget
The contracts macro is used to access the contracts of the specified protocols.
contracts(protocols: Optional[list[str]] = None)

Arguments:
	protocols (list[str], optional):
		Optional list of protocols names (case-insensitive). If left as None, or an empty
		list ([]) is passed as an argument, then all contracts will be retrieved, with
		no protocol membership contraint.

Returns:
	A select subquery with the same columns/shape as the <network>.contracts table with
	the necessary filters that the "protocols" argument dictates.
For example
-- Example 1: Get all the protocol contracts from Euler that have been deployed
-- by address 0xEe009FAF00CF54C1B4387829aF7A8Dc5f0c8C8C5
select *
from {{ ethereum.contracts(protocols=["Euler"]) }} as c
where
c.deployer = '\xEe009FAF00CF54C1B4387829aF7A8Dc5f0c8C8C5'
Further documentation
The transaction_detail table gadget
The transaction_detail macro can be used to more conveniently access the data in the similarly named transaction_detail table, which is essentially a call-trace database (includes external and internal transactions). While it’s possible to query the table directly, the macro offers some very convenient functionality for ABI-decoding calldata and returndata, as well as fetching rows from a specified time frame—e.g., all calls in the last 5 minutes.
transaction_detail(inputs: Optional[str] = None, outputs: Optional[str] = None, duration: str = env.default_duration)

Arguments:
	inputs (str, optional):
		Function signature-like string, with optional parameter names. The parameter names
		will be used to return the corresponding part of the calldata as an easy-to-consume
		column.

		The computed selector from the signature will be used to only retrieve calls on
		functions that match the providedsignature.

		An error is raised if the parameter names are not unique or have a collision with
		other returned columns.

	outputs (str, optional):
		Similar to inputs, but for parsing the return data instead.

	duration (str, optional):
		A time-like string specifying the depth of the time window that we are intersting
		in. A time expression E should look like "3d" (3 days), or "5m" (5 minutes) which
		instructs the query retrieve transaction_detail tuples with "block time" in the
		range [now, now - E].

		If left unspecified, the default value will be provided. This value is different
		based on the execution context:
			- For UI issued queries, the default duration is specified by the relecant "Default Duration"
			  configuration option.
			- For scheduler issued queries, the default duration is equal to the scheduling frequency. For
			  example, a query scheduled to run every 5 minutes, when run from the scheduler will have a
			  default duration of 5 minutes.

Returns:
	A select subquery, the shape of which includes:
    - All the columns of the <network>.transaction_detail table.
		- The ABI decoded parameters from the calldata/returndata. See the documentation of the inputs/outputs
			arguments for more details.
Example 1: Tornado cash recipients
-- Note the "recipient" named parameter in the inputs signature. This will be extracted from
-- the calldata and returned as a "recipient" column from the macro.
select tornado_cash_withdrawals.recipient, max(tornado_cash_withdrawals.block_number) as block_number
from {{ ethereum.transaction_detail(
    inputs = 'withdraw(address,bytes,bytes32,bytes32,address recipient,address,uint256,uint256)'
)}} as tornado_cash_withdrawals
where tornado_cash_withdrawals.to_a = '\xd90e2f925DA726b50C4Ed8D0Fb90Ad053324F31b'
group by tornado_cash_withdrawals.recipient
The logs table gadget
The logs macro is the EVM log analogue of the transaction_detail macro. It's a convenience macro that
simplifies the ABI decoding of log topic and data significantly, while also limiting the results to the specified
time range.
logs(inputs: Optional[str] = None, duration: str = env.default_duration)

Arguments:
    inputs (str, optional):
        Event signature-like string, with optional paramater names. The parameters will be used to
        return the corresponding part of the calldatra as columns in the produced query expression.

        The signature string can also contain `indexed` qualifiers, which indicate that the tagged event fields
        reside in the log topics instead of the data section. For example, the following two transfer events

              event Transfer(address indexed from,address indexed to,uint256 value);
              event Transfer(address indexed from,address indexed to,uint256 indexed value);

        while having identical event selectors (which is a function of the event name and types only), have quite
        different decoding logic for the event data: the former stores the transfer value in the event data segment,
        while the latter in topic[3], due to the existance of the indexed qualifier.

        All this decoding is handled transparently by the macro and exposed to the user as columns.

    duration (str, optional):
      A time-like string specifying the depth of the time window that we are intersting
      in. A time expression E should look like "3d" (3 days), or "5m" (5 minutes) which
      instructs the query retrieve logs tuples with "block time" in the
      range [now, now - E].

      If left unspecified, the default value will be provided. This value is different
      based on the execution context:
        - For UI issued queries, the default duration is specified by the relecant "Default Duration"
          configuration option.
        - For scheduler issued queries, the default duration is equal to the scheduling frequency. For
          example, a query scheduled to run every 5 minutes, when run from the scheduler will have a
          default duration of 5 minutes.

Returns:
	A select subquery, the shape of which includes:
    - All the columns of the <network>.logs table.
		- The ABI decoded parameters from the event data and topics. See the documentation of the inputs argument
      for more details.
Example: Get all transfer events. The quoting of identifiers is somethimes needed (see "from", "to" etc) to avoid SQL keyword name collisions.
select "from", "to", "value" from {{ ethereum.logs(inputs="Transfer(address indexed from,address indexed to,uint256 value)") }} _
union
select "from", "to", "value" from {{ ethereum.logs(inputs="Transfer(address indexed from,address indexed to,uint256 indexed value)") }} _
Caution: if the events you're parsing have different indexed fields than the one specified in your query, you will most likely get garbage data or missed events.
Calling smart contract functions using eth_call gadgets
The eth_call macro is used to call a smart contract function on-chain and return the result. This is a convenient way of querying the state of a contract inside the query.
{{ <network>.eth_call('address.function(args...)', outputs='types...') }}
Example: Call the name() signature of the ERC20 token contract with the address 0x6B175474E89094C44Da98b954EedeAC495271d0F on the Ethereum network.:
select * from {{ethereum.eth_call('0x6B175474E89094C44Da98b954EedeAC495271d0F.name( )', outputs='(string a)')}} _
| Result |
|---|
| Dai Stablecoin |
Query settings
A critical aspect of the behavior of a monitoring agent or query is specified through the query settings. The query settings are accessed by pressing the settings button in the query editor.
Settings for materialization
Settings for alerts
When creating an alert, the user is presented with the following modal:
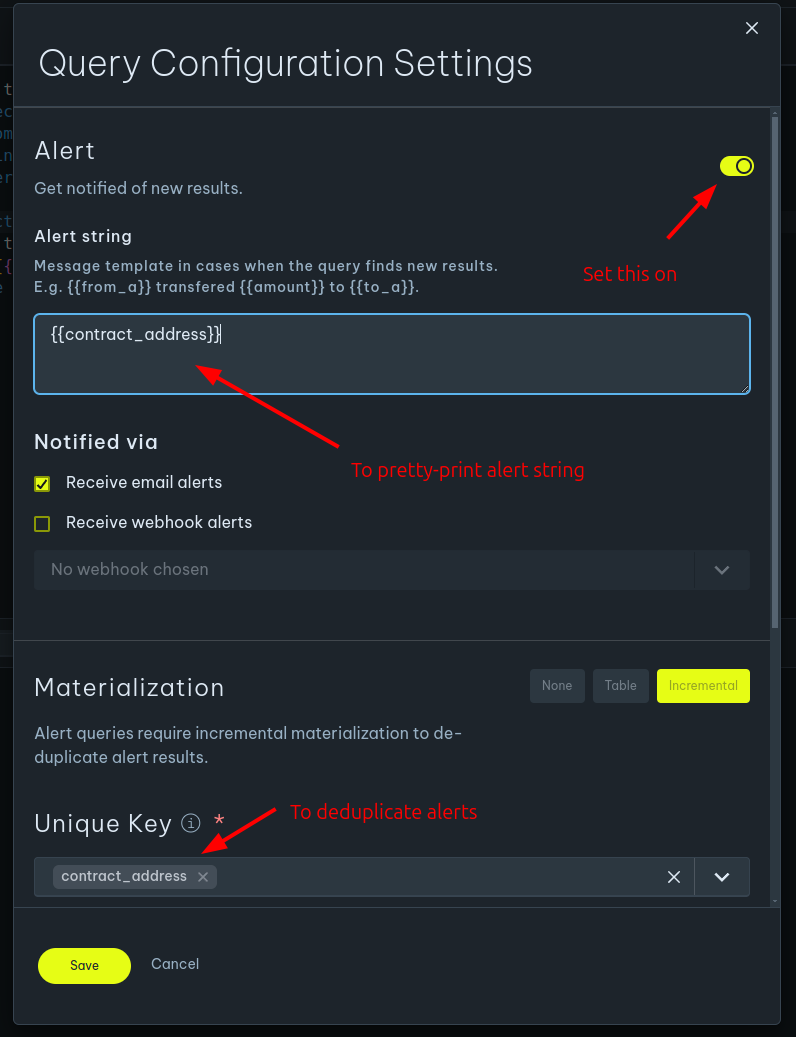
Alert string
In this field the user can (optionally) specify a Jinja template that will be used to render the SQL query result tuples into strings. The user can reference query columns with the {{column}} syntax. For example, given the query
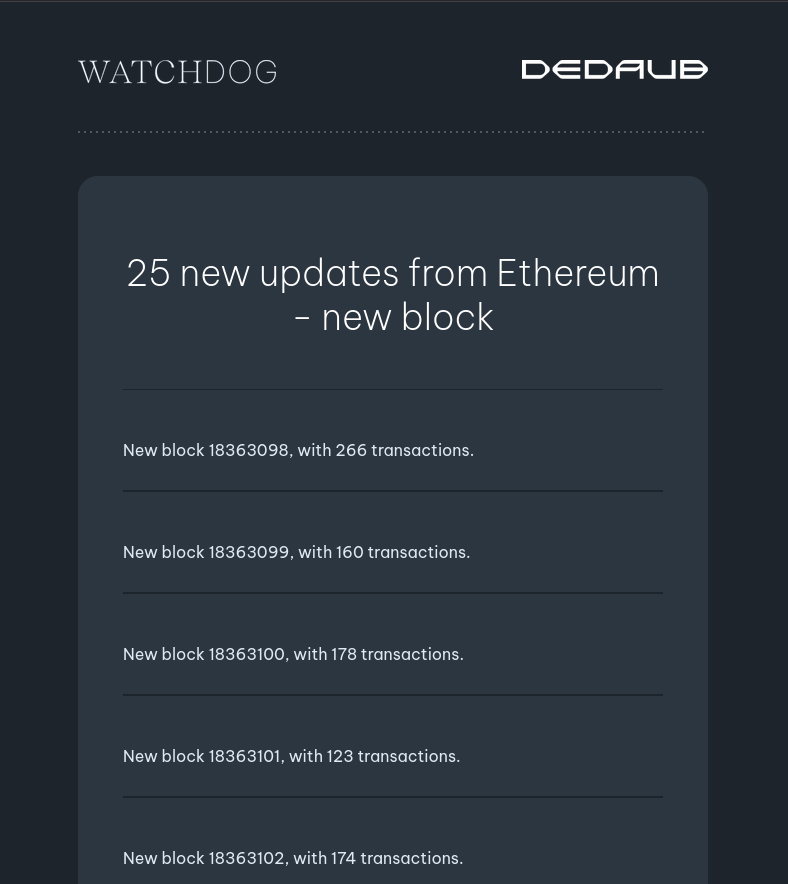
select block_number, array_length(transactions, 1) as n_txs
from {{ ethereum.block() }} _
the alert string in the screenshot above will produce strings for each result of the query, and in the end the following email will be rendered:
If no alert string is provided, a default one will be generated, that references all columns in the unique key.
Notification methods
The user can configure the notification channels that they wish to enable. The notification methods that we currently support are:
-
Email notifications
-
Webhooks
The webhook payload follows the following scheme:
{
  "id": "nf:13838.994",
  "event_type": "monitoring/alert",
  "data": {
    "query_id": 994,
    "query_name": "Ethereum - new block",
    "chain_id": 1,
    "updates": [
      // Payload specific; using sample data from above query
      {
		"block_number": 18363098,
		"n_txs": 266
      },
      ...
    ]
  }
}
For more information on creating new Webhooks in Dedaub Security Suite, read the Webhook settings docs.
Advanced use-cases
Multiple Networks
A query can be executed on every fully supported network. To run the same query across multiple networks, it can be wrapped inside a for loop.
select * from (
  {% for network in networks("ethereum", "arbitrum") %}
  (
    select {{ network }}.get_chain_id()
  )
  {% if not loop.last %} union all {% endif %}
  {% endfor %}
) _
The above example runs on Ethereum and Arbitrum, returning results for both chains. The for loop creates a subquery for each network, and the if statement (which should always appear at the end of the loop) adds a union all statement between the network-specific subqueries.
This process is easier to understand if the query is preprocessed:
select * from (
  (
    select ethereum.get_chain_id()
  )
   union all
  (
    select arbitrum.get_chain_id()
  )
) _
If the networks argument within the for statement is left empty, the query will run on all supported networks.
Network Specific Parameters
When different values are required for different networks, the params gadget can be used to define them, and the param macro can reference them.
The params gadget accepts a dictionary for each network, where custom parameters are defined.
The value can then be accessed by passing the parameter key to the param gadget using the syntax: network.param(key).
Consider the following example:
{{
  params(
    ethereum={"address": "'\\xC02aaA39b223FE8D0A0e5C4F27eAD9083C756Cc2'"},
    arbitrum={"address": "'\\x82aF49447D8a07e3bd95BD0d56f35241523fBab1'"},
  )
}}

select * from (
  {% for network in networks("ethereum", "arbitrum") %}

  (
    select {{ network }}.get_chain_id(), t.from_a
    from {{ network.transaction_detail() }} t
    where to_a = {{ network.param("address") }}
    limit 10
  )

  {% if not loop.last %} union all {% endif %}
  {% endfor %}
) _
By preprocessing the query, the following output is generated, which correctly applies the address parameter depending on the network:
select * from (

  (
    select ethereum.get_chain_id(), t.from_a
    from ( select td.* from ethereum.transaction_detail td where committed and block_number > ethereum.get_historical_block_number('24h'::interval) ) t
    where to_a = '\xC02aaA39b223FE8D0A0e5C4F27eAD9083C756Cc2'
    limit 10
  )

   union all

  (
    select arbitrum.get_chain_id(), t.from_a
    from ( select td.* from arbitrum.transaction_detail td where committed and block_number > arbitrum.get_historical_block_number('24h'::interval) ) t
    where to_a = '\x82aF49447D8a07e3bd95BD0d56f35241523fBab1'
    limit 10
  )
) _
Special String Treatment in Parameters
The address strings inside the queries are defined in the following format:
'\xC02aaA39b223FE8D0A0e5C4F27eAD9083C756Cc2'
However, inside the params gadget, the same address should be defined as:
"'\\xC02aaA39b223FE8D0A0e5C4F27eAD9083C756Cc2'"
This distinction is crucial for the correct operation of the queries.
to_address gadget
To avoid special treatment of address strings, the to_address gadget can be used. This gadget automatically converts the address string to the correct format.
Usage:
{{<address> | to_address}}
Example:
{{
  params(
    ethereum={"address": "0xC02aaA39b223FE8D0A0e5C4F27eAD9083C756Cc2"},
    arbitrum={"address": "0x82aF49447D8a07e3bd95BD0d56f35241523fBab1"},
  )
}}

select * from (
  {% for network in networks("ethereum", "arbitrum") %}

  (
    select {{ network }}.get_chain_id(), t.from_a
    from {{ network.transaction_detail() }} t
    where to_a = {{ network.param("address") | to_address }}
    limit 10
  )

  {% if not loop.last %} union all {% endif %}
  {% endfor %}
) _
to_string gadget
The to_string gadget can be used to convert a value to a string.
Usage:
{{<value> | to_string}}
Example:
{{
    params(
        ethereum = {'address': '0xc02aaa39b223fe8d0a0e5c4f27ead9083c756cc2', 'position': '0x0'}
    )
}}


select *
from
    ethereum.get_storage(
        {{ ethereum.param("address") | to_string }}, {{ ethereum.param("position") | to_string}}
    ) _
is_backfilling gadget
It is possible to check if the query is being run in backfilling mode and execute a different piece of code
{% if is_backfilling() -%}
  <query in case of backfilling>
{% else %}
  <query in case of not backfilling>
{%- endif %}
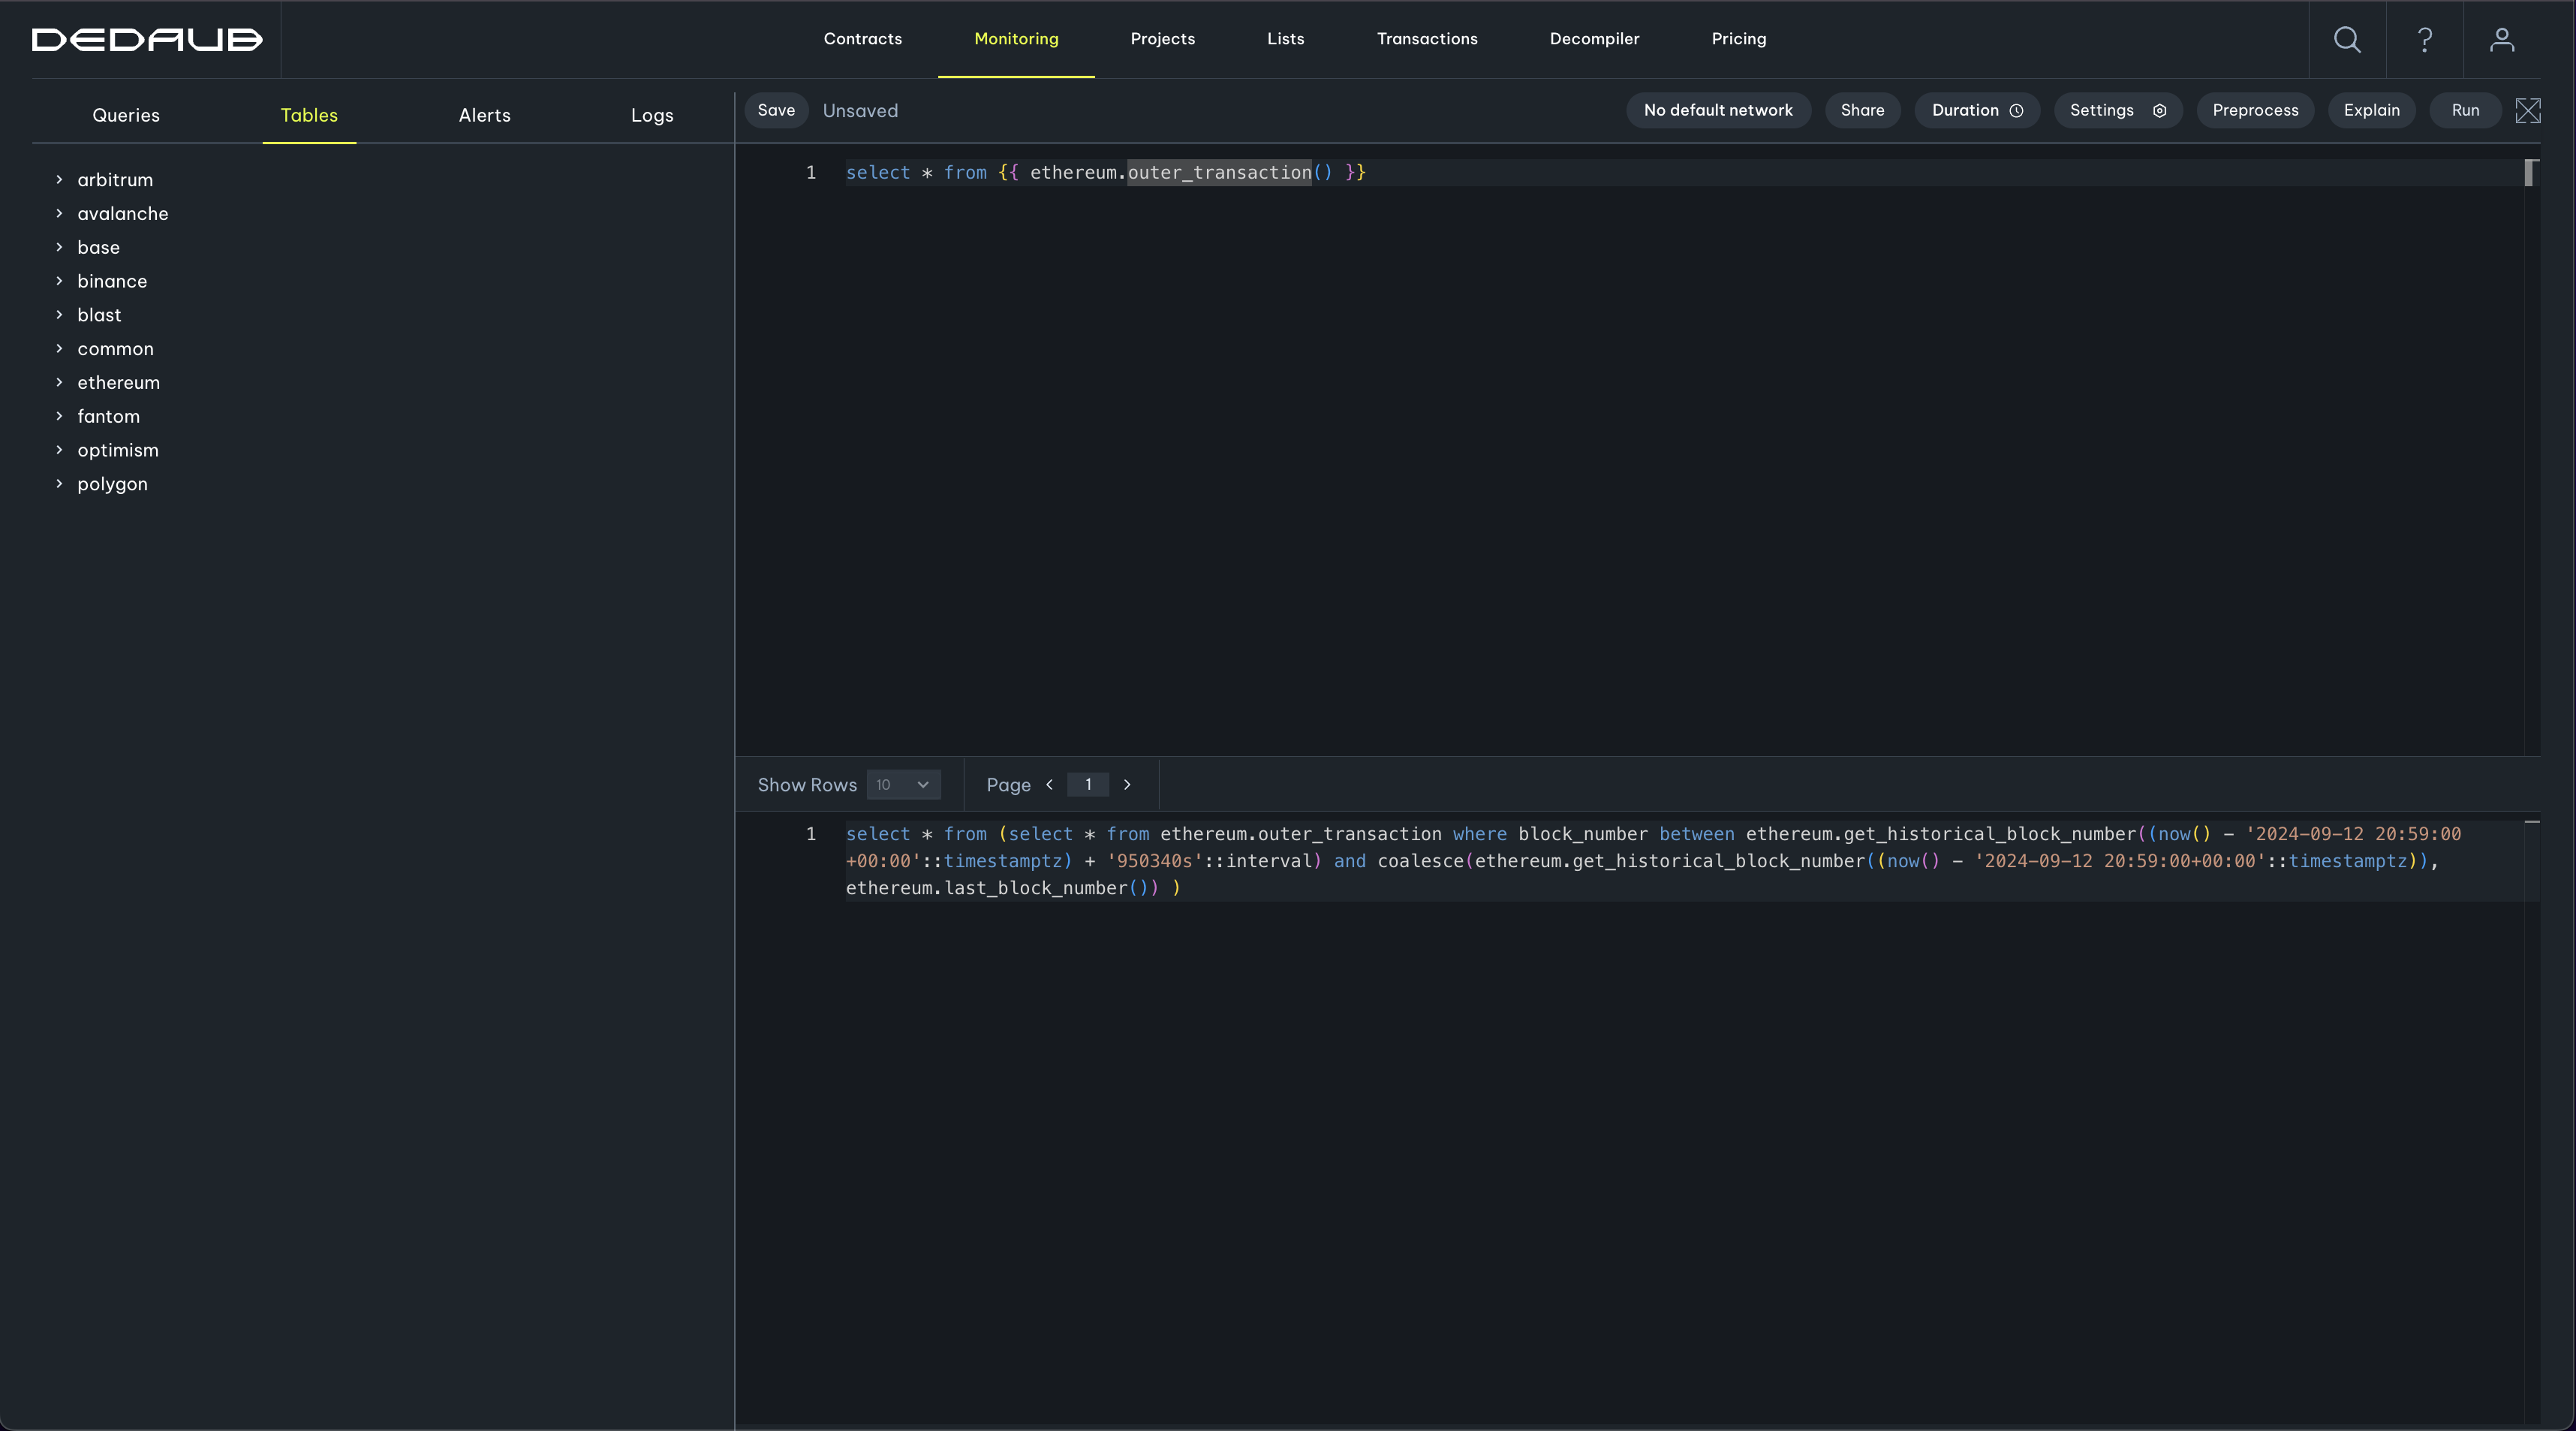
Overriding the duration of a table gadget.
The default duration of a table gadget is the last 24 hours.
select * from {{ ethereum.outer_transaction() }}
If we preprocess the above we get:
select * from (select * from ethereum.outer_transaction where block_number > ethereum.get_historical_block_number('24h'::interval))
There are two ways to override the duration of a table gadget:
- By setting a duration from the UI:
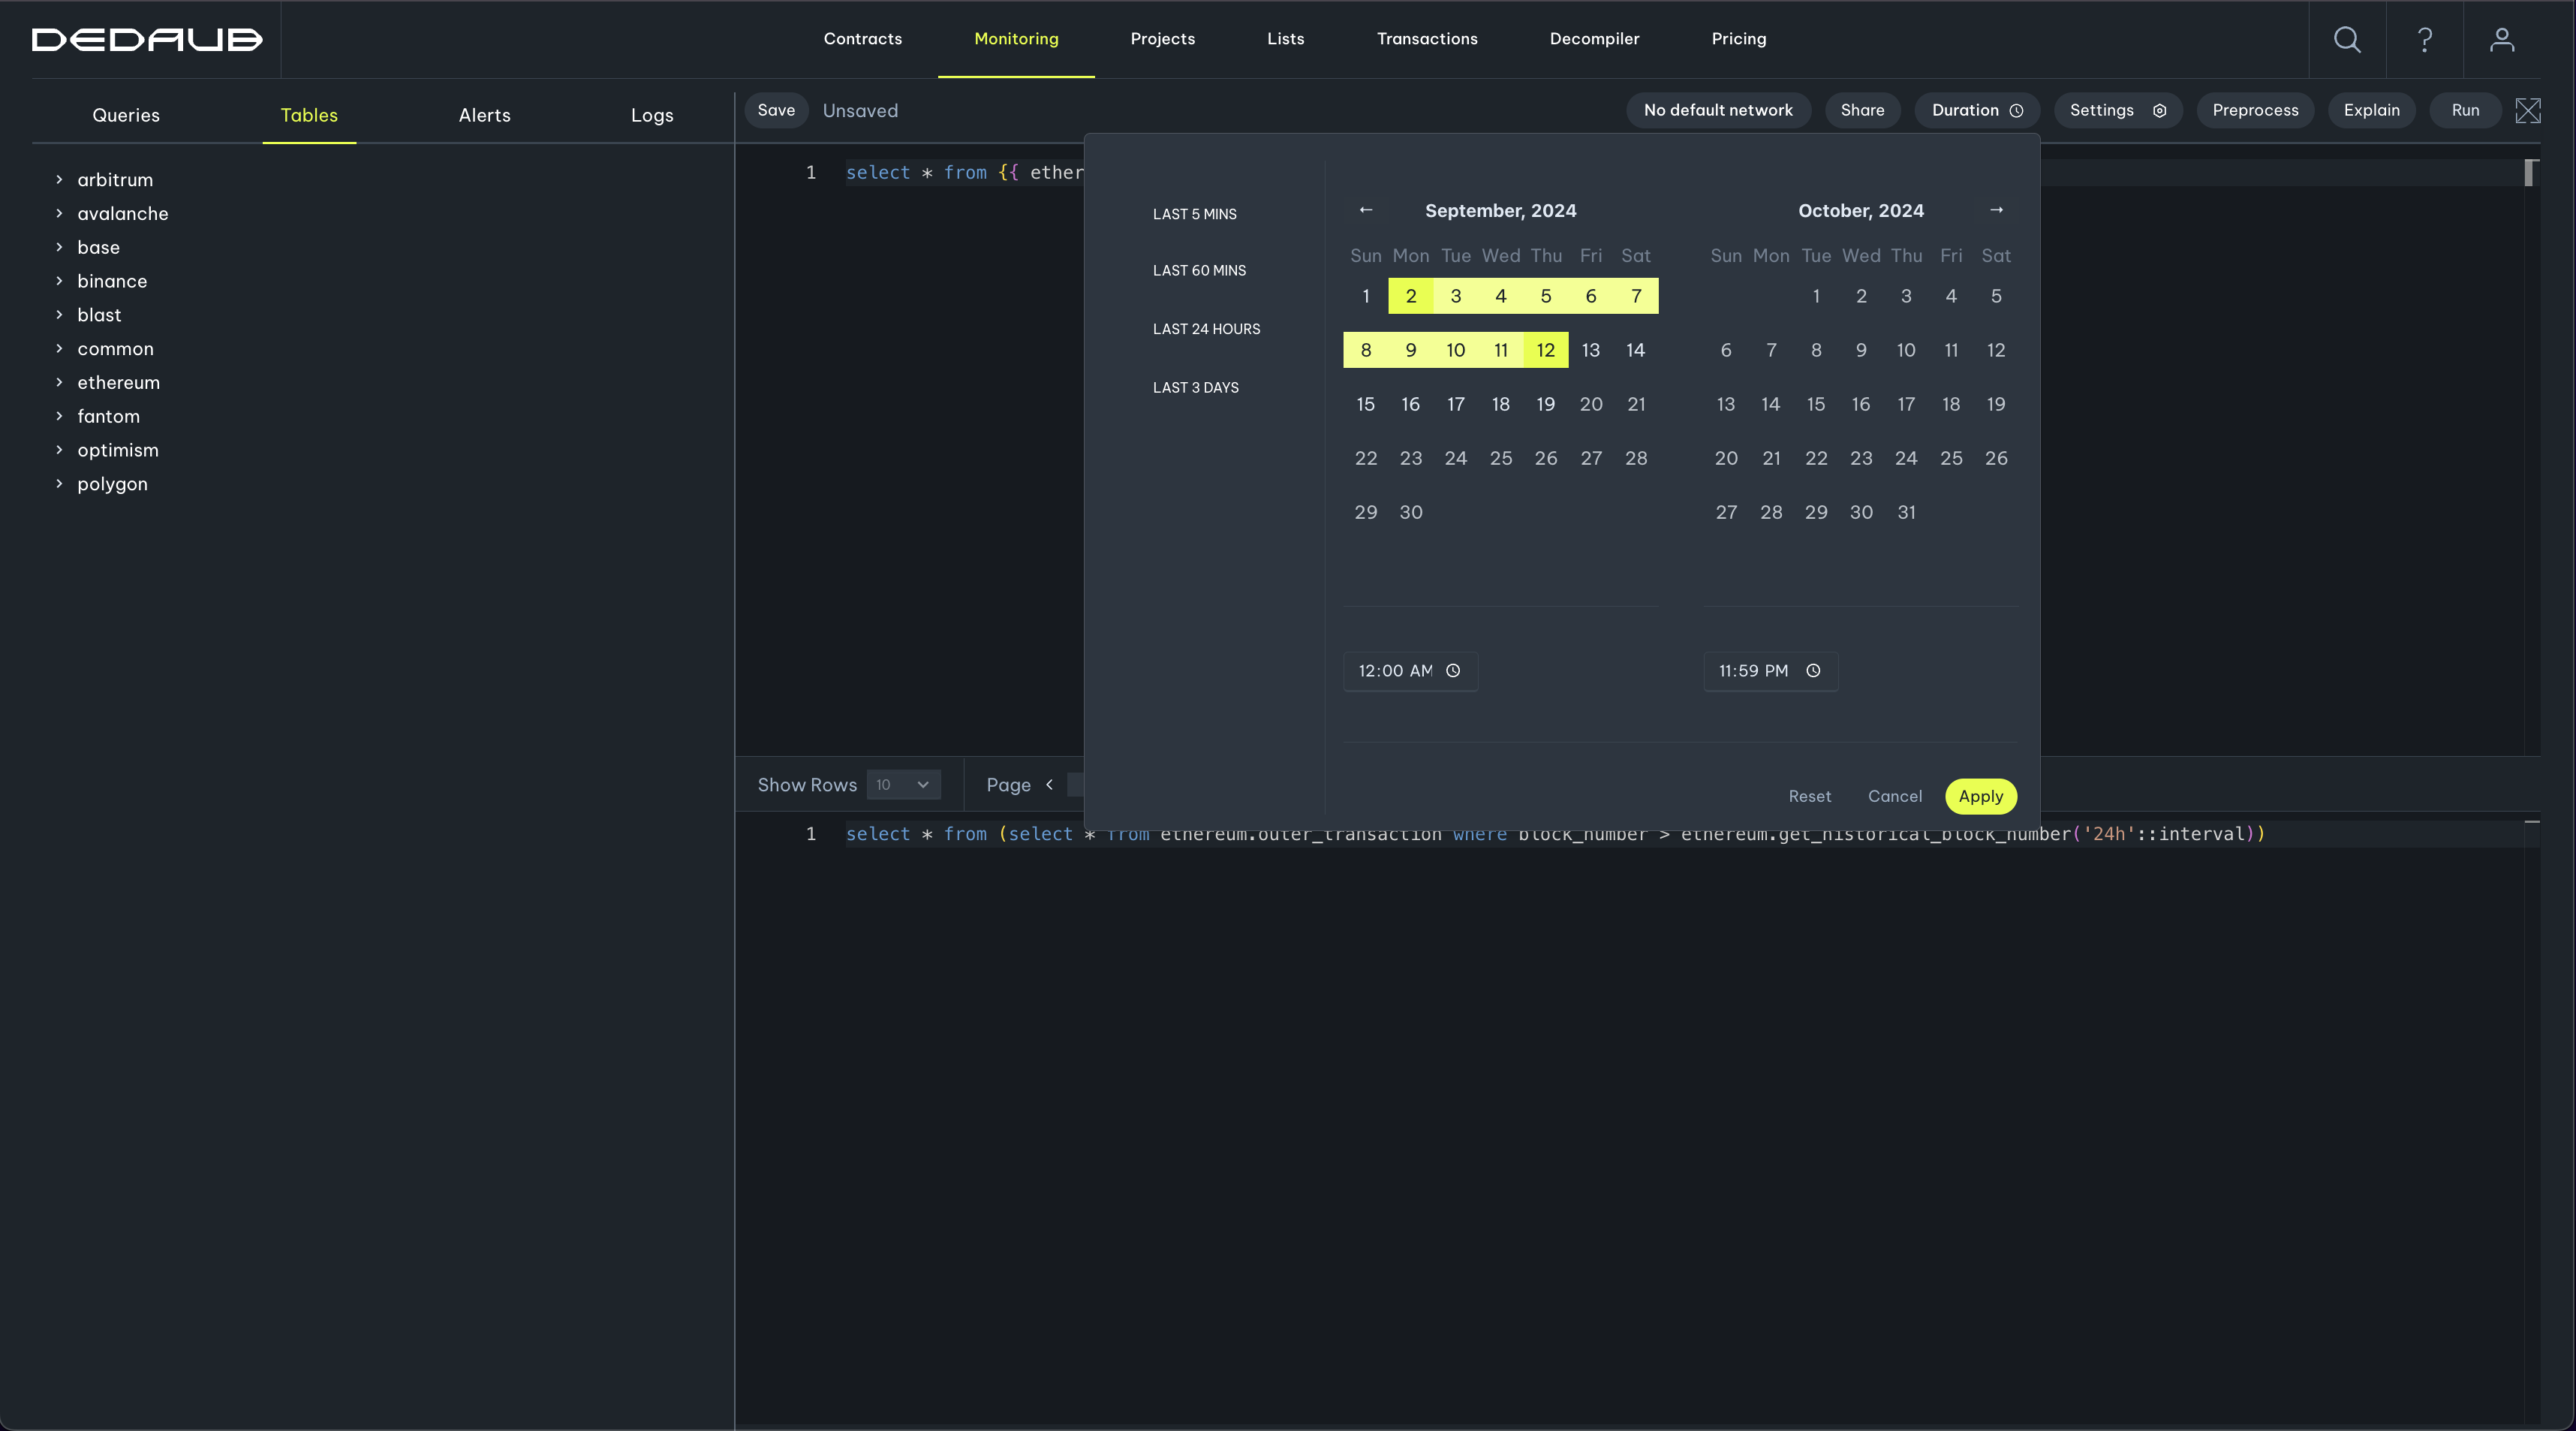
By clicking preprocess we get:
- By passing a duration argument to the table gadget:
select * from {{ ethereum.outer_transaction(duration='1h') }}
If both the UI and the duration argument are set, the latter will take effect.